http://www.inc.com/paul-spiegelman/leadership-practices-to-stop-today.html
Filed under: Uncategorized | Leave a comment »
Filed under: Uncategorized | Leave a comment »
Posted by Vincent Granville on November 17, 2012 at 10:30pm
Top 50 data science / big data techniques, described in less than 40 words, for decision makers. Please help us: any definition that you fill will have your name attached to it: send your definition or new term and definition to vincentg@datashaping.com.
Reference: Introduction to Machine Learning, Ethem Alpaydin, The MIT Press (2004)
Filed under: Uncategorized | Leave a comment »
Analytic challenges and opportunities are shaking up the healthcare industry. Policy and regulatory changes that affect reimbursement and patient-care performance are forcing organizations to move quickly to improve data analysis.
Leveraging the new generation of business intelligence (BI), data discovery, dashboards, and analytics can help organizations replace slow, manual, spreadsheet-based processes. Based on real-world experiences at Swedish Medical Group, this Webinar will discuss how BI and analytics can be applied to the challenges faced by today’s healthcare providers and systems.
Join David Stodder, TDWI Research Director for Business Intelligence, for this special webinar produced jointly by TDWI and MedTech Media, publisher of the award-winning Healthcare IT News and Healthcare Finance News, as well as Healthcare Payer News and other brands: Actionable Analytics for Healthcare Providers.
You will learn about:
Register Now: Actionable Analytics for Healthcare Providers
When: December 10, 2012, 9:00 a.m. PT
Speaker: David Stodder
Guest Speakers:
David Delafield, Chief Financial Officer, Swedish Medical Group
Ted Corbett, Founder, Vizual Outcomes, LLC
Stay Current and Connected: Register for multiple upcoming Webinars
Filed under: Uncategorized | Leave a comment »
Company Announces First Round of Members Enrolled in NuoConnect
Cambridge, MA — November 14, 2012 — NuoDB, Inc., a startup offering the industry’s onlypatented, elastically-scalable Emergent Database for the cloud, today announced NuoConnect, a developer partner program for technology partners, IT service and consulting firms, Independent Software Vendors (ISVs), and cloud providers.
The NuoConnect program offers the following benefits for participants:
Simultaneously, the company announced their Release Candidate 1 (RC1), which is now available for immediate download by the general public. With RC1, NuoDB also released information on the pricing and licensing model for their commercial software that will be made generally available in the next 30-60 days. That release is entitled: NuoDB Gathers Momentum with Release Candidate of Industry’s Only Emergent Database
The NuoConnect program launches with cutting edge application development partners on board. These include:
Technology partner:
IT Service and consulting firms:
“We are excited to be partnering with NuoDB and fully expect that the combination of their technology being accessed with ours will create a compelling offering for enterprise developers and software architects,” stated Scott Ling, CEO at Awesome API
“Firebase.co is delighted to join NuoConnect. We have been testing NuoDB with exciting results and are looking forward to putting it into production with a new web-scale application we are currently developing,” stated Johan Hernandez, CEO, Firebase.co.
“We decided to launch NuoConnect prior to general availability due to partner demand. Response to the program has been overwhelmingly positive and we especially appreciate this group of early partners who have already chosen to start providing a true 21st century database to their customers,” stated Barry Morris, Co-Founder and CEO of NuoDB. “We will ramp NuoConnect rapidly over the coming months. These early partners are joining us in changing the rules for relational databases to address a whole new set of applications.”
NuoDB, Inc., is a Cambridge, MA-based startup that provides the industry’s first and onlypatented elastically scalable, emergent database. Unlike every other database, NuoDB is architected to scale effortlessly on the cloud without compromising any of the features or guarantees of relational databases.
NuoDB is the brainchild of industry-renowned database architect and innovator Jim Starkey. NuoDB was launched in 2010 by Starkey and software CEO Barry Morris.
Filed under: Uncategorized | Leave a comment »
One of the most common questions I get asked is how to get started with data visualisations. Beyond following blogs, you need to practise – and to practise, you need to understand the tools available. In this article, I want to introduce you to 20 different tools for creating visualisations: from simple charts to complex graphs, maps and infographics. Almost everything here is available for free, and some you have probably installed already. READ MORE
Filed under: Uncategorized | Leave a comment »
What are the factors to consider when creating a BI and analytics strategy?
A. IDC encourages organizations to develop an organizationwide BI and analytics strategy that articulates responses to the following questions:
What are our organization’s business objectives, challenges, and goals, and how do we measure progress toward these goals?
Are our BI objectives aligned with our business objectives? What metrics or key performance indicators (KPIs) exist to ensure that measurement of progress toward organizational goals is made possible?
What are the types of strategic, operational, and tactical decisions being made at different levels in our organization?
Who are the different user groups and user types making these decisions?
What data sources are required to support the decisions being made at our organization?
What BI and analytics technology functionality is required to support the types of decisions and decision-making processes of various end-user groups, including executives, managers, business analysts, quantitative analysts, operational staff, customer-facing staff, and external stakeholders?
What staffing needs and organizational structure are required to ensure that individuals or teams exist to address tasks such as data integration, data quality, data management, master data management, report or dashboard development, data analysis, and
information access?
What technology components exist or are needed to ensure that the decision support or automation needs of all decision makers are addressed?
Responses to these questions will assist you in defining a long-term BI and analytics strategy. However, it’s also important to conduct a periodic assessment of responses to these questions and a review of the level of BI and analytics competency and pervasiveness in
your organization
Best_Practices_for_a_BI_and_Analytics_Strategy
Filed under: Uncategorized | Leave a comment »
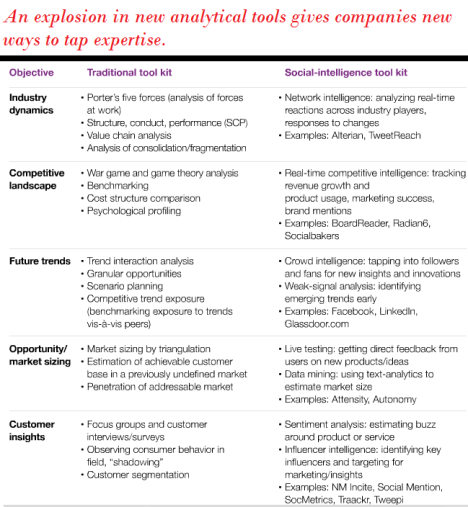
An explosion in new analytical tools gives companies new ways to tap expertise.
Filed under: Uncategorized | Leave a comment »
Confused on how to evaluate dashboards? Unsure what the differences are with scorecards and dashboards? TDWI is hosting a webcast with BI Scorecard analyst Cindi Howson and Actuate on building dashboards for real business results.
Since dashboards have rapidly moved to become the face of business intelligence, BI teams are charged with evaluating new solutions, sometimes integrating with existing BI platforms or replacing previously custom-developed solutions. Yet not all dashboard products are the same, and adding to the confusion is the role of scorecards.
In this webinar, learn the role dashboards play in BI success and key features to consider. You will learn:
• The role of dashboards in BI success and business alignment
• Key features to look for when evaluating dashboards
• The differences with scorecards
It is a day of education you will not want to miss December 11th at 9 AM PT. Register today:http://bit.ly/RN0GE0
Filed under: Uncategorized | Leave a comment »